Client Success Story

Semantic Segmentation on RGB Satellite Images to Train AI Models for Environmental Monitoring and Analysis

98%

Annotation
Accuracy

99%

Client Acceptance
Rate

Service

  • Image Annotation

Platform

  • CVAT
THE CLIENT

Industry Leader in Environmental Monitoring & Satellite Data Analysis

This European technology company works with governments, environmental agencies, and businesses worldwide to track and understand changes happening on Earth's surface—from water resources to climate patterns. By converting complex satellite imagery into clear, actionable insights through AI-powered analysis, they enable their clients to make informed decisions about environmental management, disaster preparedness, and resource planning.

PROJECT REQUIREMENTS

Pixel-wise Semantic Segmentation on RGB Satellite Imagery

The client needed to train an AI model to automatically identify and differentiate between water bodies and ice formations across different seasons—a critical capability for accurate environmental monitoring throughout the year. For this purpose, they sought our geospatial image annotation services, specifically semantic segmentation on RGB satellite images.

Every single pixel needed to be accurately labeled into one of three distinct classes:

  • Water - Liquid water bodies
  • Ice-Solid - Completely frozen, hard ice formations
  • Ice-Slush - Partially melted, slushy ice (the transitional state)

Additionally, the project scope included:

  • Volume: 8,500 satellite images of river systems across three seasonal states (winter freeze, spring thaw, summer flow)
  • Timeline: 10 weeks for complete delivery of annotated images
  • Coverage: River systems captured during winter, spring, and early summer transitions
  • Precision: Minimum labeling accuracy threshold of 96% for client acceptance
PROJECT CHALLENGES

Classifying Visually Similar Ice States with Subtle Differences

In this semantic segmentation project, the complexity stemmed not just from the volume of work, but from the nuanced decision-making required at every pixel.

Distinguishing Visually Similar Ice States

The most significant technical challenge was differentiating between Ice-Solid and Ice-Slush in satellite imagery. Unlike ground-level observation, satellite RGB images often show subtle tonal and textural differences between these two states. Ice-slush (being a transitional phase) can appear nearly identical to solid ice depending on lighting conditions, image resolution, and the degree of melting.

Additionally, annotation guidelines for ambiguous scenarios—such as shadows on ice, partially submerged formations, or reflective water surfaces—were initially undefined. To ensure consistency, we involved subject matter experts who could formalize clear criteria for these edge cases by discussing the matter with the client.

Maintaining Consistency across Seasonal Variations

The image dataset spanned three distinct seasonal states, each presenting different visual characteristics:

  • Winter images showed clear ice formations but varied in snow cover and lighting
  • Spring images contained the most ambiguous ice-slush boundaries
  • Summer images had clear water but occasional ice remnants in shadowed areas (in early summer)

Our challenge was to ensure that annotators applied consistent classification logic across these varying conditions.

Pixel-Level Precision at Scale

Semantic segmentation at the pixel level is exponentially more demanding than bounding box or polygon annotation. With bounding boxes, we can only mark a rough area around an object, and polygons are used to trace general outlines. However, pixel-level segmentation involves determining exactly which pixels belong to the object and which do not. That’s especially difficult when objects have soft or irregular edges.

With 8,500 high-resolution images, our data annotation team was looking at potentially millions of individual pixels. Additionally, we had to maintain edge accuracy along irregular shorelines and ice boundaries and avoid any annotation drift over the course of the project.

OUR SOLUTION

Overcoming Image Labeling Complexity with Intensive Training and Custom Automation

A team of 20 image labeling professionals (13 annotators, 4 QA specialists, 2 SMEs, and a project coordinator) was aligned with this client. Given the technical complexity and initially undefined edge cases, we brought in domain experts (professional annotators with experience in geospatial or scientific image analysis) who collaborated with the client to establish clear criteria for ambiguous scenarios and address new edge cases as they emerged.

1

Two Weeks of Intensive Training to Ensure High Labeling Accuracy

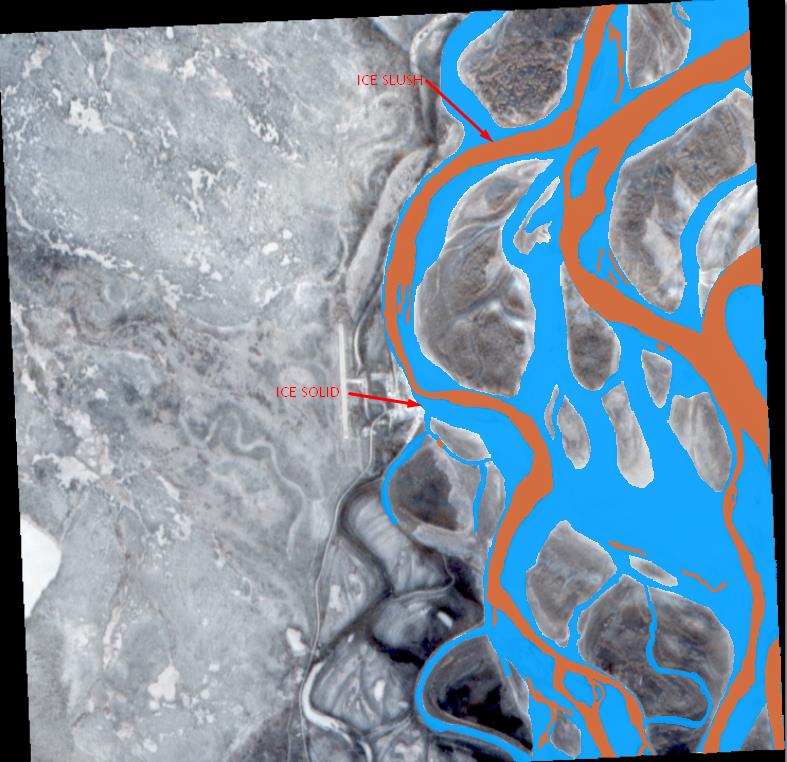
The first week of training covered satellite imagery fundamentals, ice formation science, and RGB interpretation. Under subject matter experts, the data labeling team learned to identify specific visual indicators that differentiate ice-solid from ice-slush (texture patterns, tonal gradients, boundary sharpness, reflectivity differences, etc.). They were also introduced to edge-case scenarios with reference examples categorized by difficulty level.

In week two, our team worked on 300 practice images selected by SMEs to represent the full spectrum of complexity. Each annotator's work was compared against SME "ground truth" annotations to identify and correct interpretation gaps. The decision criteria for each labeling and edge case were documented, and a comprehensive reference was assembled with visual examples, decision trees, and troubleshooting guides.

2

Image Annotation Platform Setup – CVAT

We used CVAT for image annotation, as it has proven highly effective for labeling tasks that require pixel-level precision (in this case, along irregular shorelines and ice boundaries), based on our experience in image as well as video annotation projects. Our team customized CVAT to match the client’s requirements.

  • Custom Keyboard Shortcuts: Configured single-key class switching (W for Water, S for Ice-Solid, L for Ice-Slush), reducing annotation time by approximately 15-20% by eliminating repeated menu navigation.
  • Color-Coded Class Visualization: Assigned contrasting colors to each class (blue for Water, green for Ice-Solid, white for Ice-Slush) to make misclassifications immediately visible during annotation.
  • Zoom Presets: Created standardized zoom levels (100%, 200%, 400%) for consistent edge boundary work across all annotators.
  • Annotation Templates: Pre-loaded common edge cases as reference overlays that annotators could toggle on/off for guidance.
  • Batch Loading Optimization: Configured image pre-loading to minimize wait times between annotations, keeping annotators in a focused workflow.
3

Sequential Dataset Segmentation

The dataset provided by the client was already divided into seasonal groups. We assigned a dedicated sub-team to each season’s dataset, allowing the team to develop familiarity with specific patterns within a particular group. We also rotated reviewers between seasonal teams so the annotation logic applied to one seasonal dataset aligned with the others, maintaining semantic consistency across all the images.

4

Annotation Drift Detection

Over time, repeated annotation tasks can lead to slight variations in how annotators interpret similar images, resulting in labeling drift. To prevent this, each batch of labeled data was systematically reviewed and compared against previous outputs.

When inconsistencies were identified (for example, differing treatment of melting ice edges between spring and early summer), subject matter experts refined and updated the annotation guidelines to maintain conceptual consistency.

Eventually, to expedite this process, we built an automated annotation drift detection script. It analyzed clusters of related images (for example, 10 winter images of the same river bend from the same location and season) to identify subtle shifts in labeling behavior across time or between annotators. Any detected anomalies were flagged for expert review, ensuring uniformity and reliability in the final dataset.

5

Semi-Automated Edge Detection

Accurately tracing complex class boundaries had quickly become the most time-consuming aspect of this project, so we implemented a computer vision-based edge detection solution. The algorithm analyzed RGB gradients to identify sharp transitions between water, ice-solid, and ice-slush regions (sudden changes in color or brightness between neighboring pixels).

These computer-generated boundary suggestions were displayed to annotators in CVAT, allowing them to accept, refine, or override the automated outlines, reducing manual tracing time by approximately 30% while maintaining human oversight for accuracy.
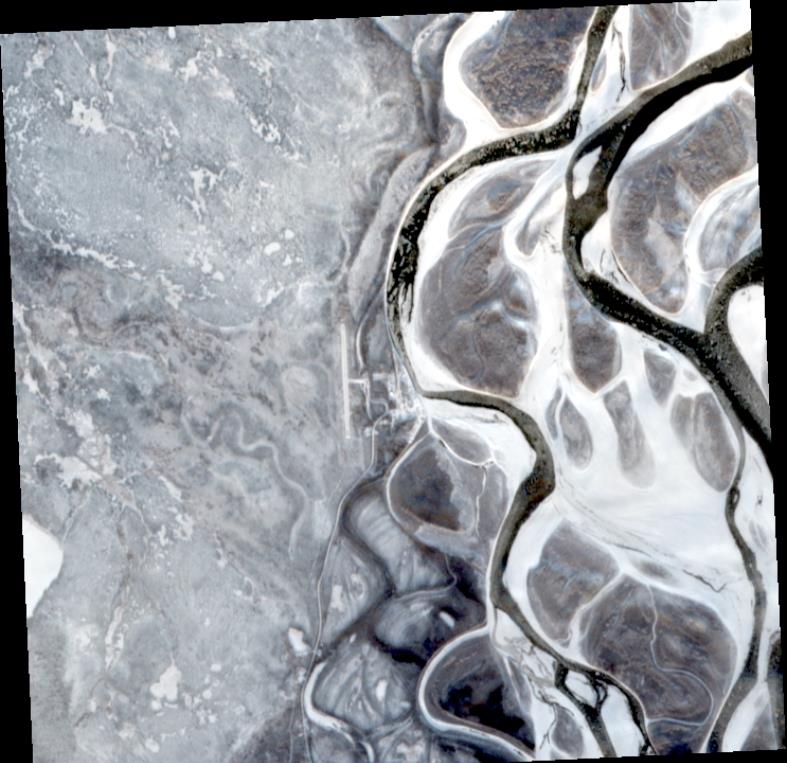
Raw image

Raw image

Annotated image

Annotated image

Project Outcomes

With the combined efforts of SME-led training, optimized image annotation workflows, and selective automation, we successfully delivered the project ahead of the scheduled deadline. The client adopted our annotation reference guide and edge case documentation as an internal standard for future geospatial annotation projects and also extended their contract with our team for ongoing image labeling as well as text annotation services (to label satellite image metadata, environmental research reports, and related documentation).

Early Project Delivery

All images annotated and delivered 2 weeks ahead of the original 10-week timeline.

98% Annotation Accuracy

Significantly exceeding the client's 96% minimum labeling accuracy threshold.

99% Client Acceptance Rate

Eliminating the need for dataset corrections or re-annotation cycles.

We’ve worked with some data annotation companies before, but this was the first time we didn’t have to worry about much. The annotations were very accurate and delivered ahead of schedule.

- Senior Data Scientist & Project Manager

CONTACT US

Get Precise Data Annotation Support for Real-World Conditions

Complex images, ambiguous data, tight timelines - if that describes your project, we can help. Our image annotation service combines domain expertise with adaptable workflows to deliver accurate training data for just about any use case, be it a solar panel defect detection AI, satellite image labeling, or waterbody annotation for geographic data mapping.

Request a free sample to evaluate our data annotation quality.