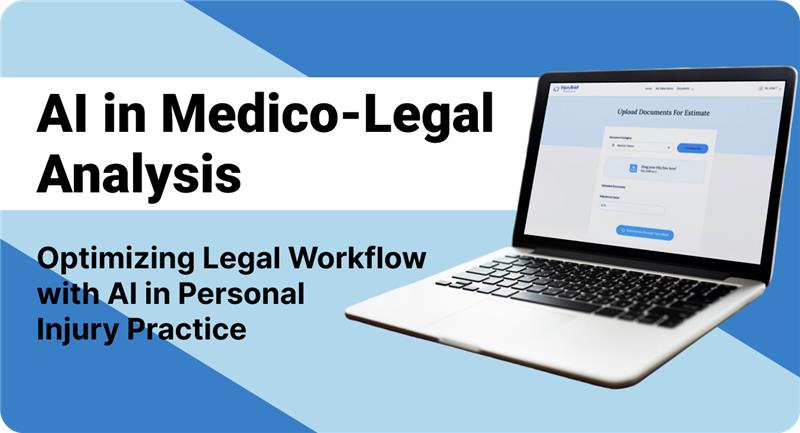
See how we delivered a scalable AI-powered solution for personal injury practitioners to automate document processing, case analysis, and client management.
Hire Data Visualization Experts
Our Comprehensive Data Visualization Services
To help your leadership team make faster decisions, we turn overwhelming numbers into clear, visual stories. Explore all the data visualization services our experts provide, from expert consultation to custom dashboards.
Data Visualization Consultation
Maximize ROI on your data investments with expert data consultation. Our data visualization consultants provide architectural oversight to turn fragmented systems into cohesive systems. We begin with BI Maturity Audits to map your end-to-end data lineage and provide a comprehensive Technical Blueprint to remediate structural debt and support High Concurrency. Beyond simple tool selection, we architect robust Data Governance and Security frameworks, ensuring your visualization roadmap remains fully compliant with GDPR, CCPA, SOC 2, and HIPAA standards.
Data Analytics and Interpretation
Pivot from raw observation to strategic narratives with our data research & analytics services. We transform complex datasets through rigorous EDA and Inferential Statistics. To ensure absolute analytical precision, we integrate specialized R and Python libraries (Scikit-learn, Pandas, and Tidyverse) directly into your research ecosystem. This enables the execution of complex k-means Clustering, Anomaly Detection, and Correlation Matrices within your live analytical environment to provide your leadership with a quantified risk-assessment framework.
Data Visualization Services
Transform basic charting into intuitive dashboards. Our data visualization specialists utilize Scrollytelling and Tooltip Enrichment to bridge the gap between raw numbers and actionable insights by architecting dashboards that prioritize clarity, immediate context, and executive-level storytelling. We utilize Preattentive Processing and Gestalt principles to ensure that critical outliers and performance anomalies are visually surfaced. By integrating specialized visual encoding, we select the optimal color scales and geometric layouts to prevent data misinterpretation and ensure accessibility.
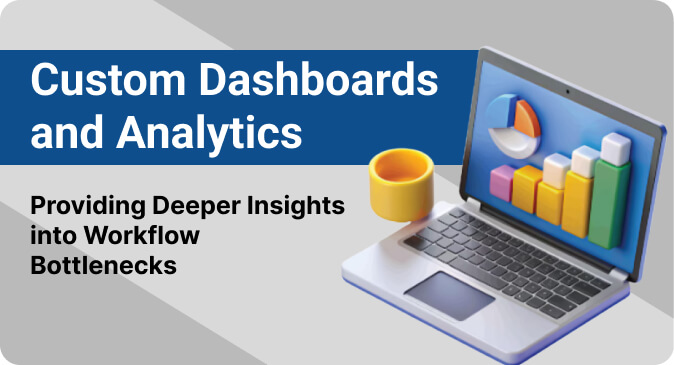
Custom Dashboard Development
Hire data visualization developers to develop high-performance custom dashboards. Our experts are proficient in working with leading BI tools like Power BI, Tableau, Looker, etc., as per your requirements. Our solutions typically include interactive KPI cards, trend analysis charts, geospatial mapping, and comparative distribution plots to provide a 360-degree view of business health. We deploy on cloud platforms (AWS, GCP, Azure) for seamless scaling, use data lakehouses for secure & cost-efficient storage, and third-party APIs for service interoperability. We can also configure alert-based monitoring and governed access control.
Custom Report Development
Hire data visualization developers to convert complex data ingestion streams into high-fidelity reports for strategic decision-making. We architect Reporting Systems leveraging semantic models and platform-specific tools like Power BI Report Builder and Tableau Desktop to ensure precise layout control and data accuracy. Our approach prioritizes reusable business logic and consistent metrics across all departments, from financial and compliance reporting to executive summaries. We focus on automating reporting with complete data traceability and controlled distribution, providing a reliable foundation for operational and management reviews.
Multi-Source Data Integration
Eliminate the risk of conflicting data narratives and departmental silos. Our experts build ETL/ELT pipelines that seamlessly aggregate disparate data streams from Cloud Data Warehouses, On-premise SQL clusters, and fragmented SaaS APIs. We use orchestration tools like Azure Data Factory, AWS Glue, or dbt (depending on your requirements) to architect a unified Semantic Layer that ensures every visualization is powered in real-time. Our specialists focus on implementing robust Schema-on-Read and Schema-on-Write protocols to handle both structured and semi-structured datasets.
Dashboard Optimization and Enhancement
Lower your cloud compute costs with dashboard performance optimization. We eliminate dashboard latency by re-engineering legacy systems. Our specialists conduct deep audits of your DAX and SQL query performance, implement Star Schema architecture, and optimize Query Folding to push computational heavy-lifting back to the source database level. This performance tuning includes revitalizing UI/UX enhancement by integrating Dynamic Navigation Panes and Conditional Formatting to ensure your BI assets are modernized for peak operational efficiency.
BI Support and Maintenance
Protect your BI infrastructure from downtime and ensure compliance with data standards. Our maintenance and support services focus on proactive Environment Monitoring and Data Governance. We manage the entire lifecycle of your BI assets, from regular Data Lineage audits and security patch deployments to the management of Dynamic Row-Level Security (RLS) and Object-Level Security (OLS). Our commitment to ISO 27001, GDPR, and HIPAA standards ensures that your most sensitive IP is protected through a robust framework.
Managed Talent. Engineered for Accountability.
Dedicated Full-Time Engineers
FTEs only No freelancers or gig marketplace.

Experienced Talent
Vetted Experts Rapid Deployment
Managed Operations
Senior oversight Time & Task Monitoring
Workflow-Ready Integration
Jira Slack GitHub Teams
Global Overlap
All Time Zones 24/7 Support
Security
ISO 27001 & CMMI3 NDA & IP Secure
Send an Inquiry
Accelerate Decision-Making with Intuitive Data Visualization
Hire data visualization specialists to create interactive dashboards that streamline reporting and give leadership teams clear insights to drive faster growth.
Start Today
BI and Data Visualization Tools
From Tableau and Qlik to Power BI visualization services, we leverage a wide range of industry-leading business intelligence (BI) and data visualization tools to deliver the expected results.


Security and Compliance
Your data security is our priority

ISO
Certified

HIPAA compliance

GDPR adherence

Regular security audits

Encrypted data transmission

Secure cloud storage
Tech Stack
Languages and core frameworks used by our data visualization specialists.
- Data Visualization Platforms Google Developer Charts Microsoft Excel Chartist.js FusionCharts Kyubit Sisense Chartblocs D3 Data-wrapper MicroStrategy RAW Plotly Tableau PowerBI Qlik
- Languages HTML CSS JS (JavaScript) Vue.js React Angular
- Data Storage Azure Blob Storage Amazon Simple Storage Service (S3) Azure Data Lake MongoDB Amazon Redshift
- Visualization Libraries Chart.js JSCharting D3.js Highcharts FusionCharts
- Cloud-Based Solutions Amazon QuickSight Google Data Studio Microsoft Azure Monitor
- Big Data Apache Spark Amazon Redshift Apache Hive
- Visualization Tools Re:dash Data Wrapper Plotly Saiku
Frequently Asked Questions
Hire Data Visualization Experts: FAQs
Our data visualization experts improve decision-making by transforming fragmented data into a unified view. We engineer custom monitoring dashboards that surface real-time performance trends, allowing your leadership to address operational risks before they escalate. By identifying your "North Star" metrics and automating complex reports, we eliminate manual guesswork. This clarity ensures your team spends less time searching for information and more time executing data-backed strategies.
We achieve actionability through Cognitive UI/UX designs and Strategic Storytelling. Our data visualization specialists apply Preattentive Processing within the dashboards to highlight outliers instantly. Beyond aesthetics, we integrate Predictive Analytics (R/Python) and Drill-Down capabilities, ensuring executives understand the why, driving immediate interventions based on granular operational data.
Absolutely. We facilitate seamless team integration by aligning our experts with your local business hours. This overlap ensures real-time synchronization and agile collaboration via Slack, Jira, or Teams. Our developers act as a direct extension of your internal department, participating in daily stand-ups and sprint planning to maintain high project momentum.
We offer a flexible engagement framework that allows you to start with a Pilot Project or MVP on a project-based engagement model. Later, you can seamlessly scale into a Dedicated Development Team (DDT) model to meet your project requirements.
We secure Intellectual Property (IP) through stringent Master Service Agreements (MSAs) and project-specific NDAs. All code, data models, and custom visualizations created by our experts are the exclusive property of the client. Our data visualization experts operate within your secure environment, ensuring that your trade secrets and proprietary algorithms remain strictly under your institutional control at all times.
Yes, our data visualization experts are proficient in engineering Dynamic Row-Level Security (RLS) and Object-Level Security (OLS). As an ISO/IEC 27001:2022 certified firm, we strictly adhere to GDPR, HIPAA, and SOC2 protocols. We work within restricted datasets, ensuring that sensitive PII or financial data is only accessible to authorized personnel through role-based frameworks.